Dataset Walkthrough
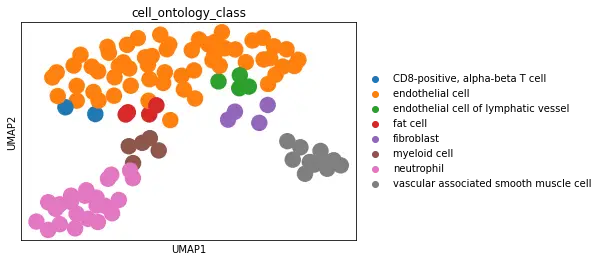
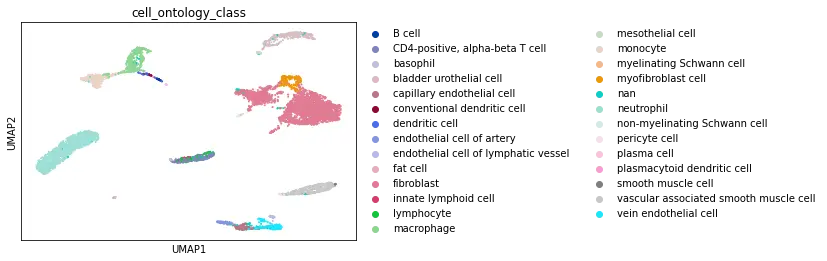
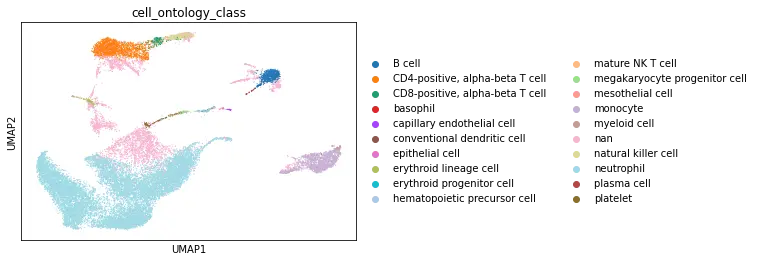
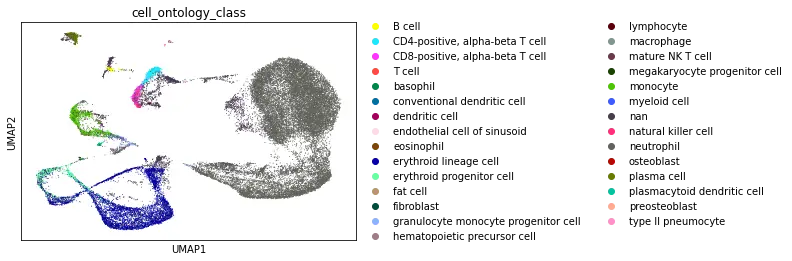
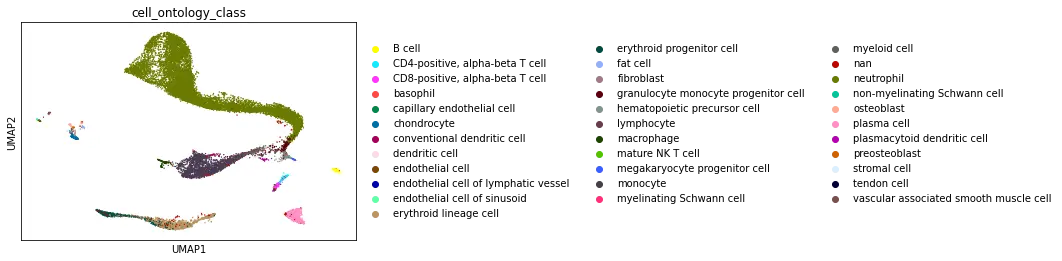
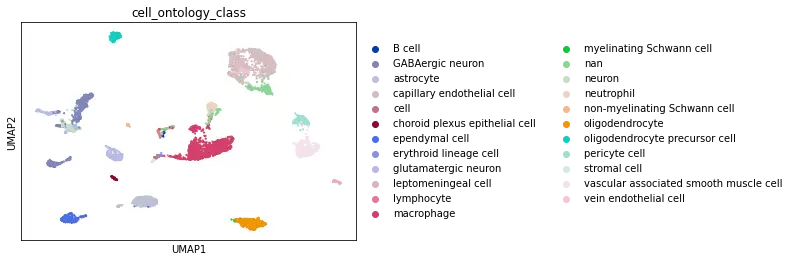
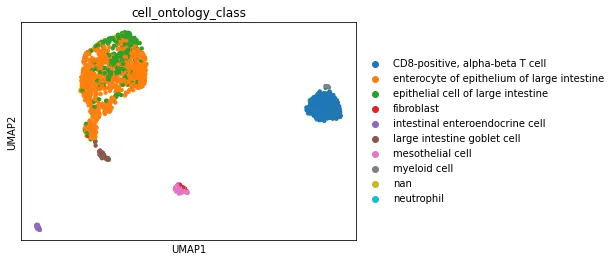
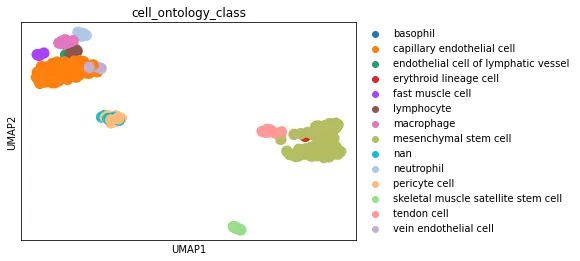
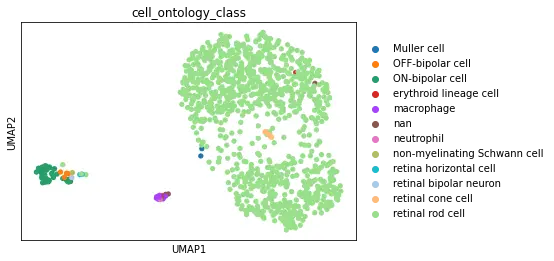
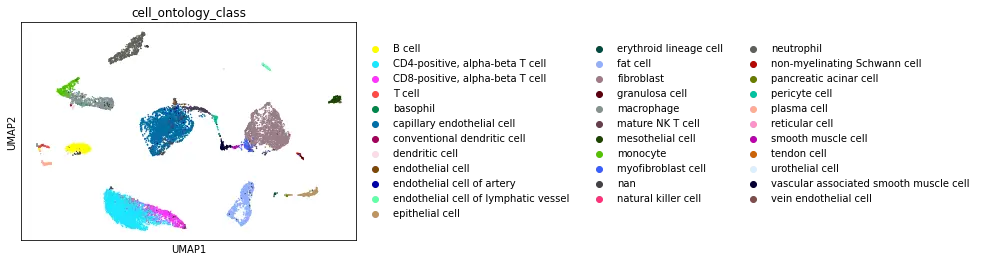
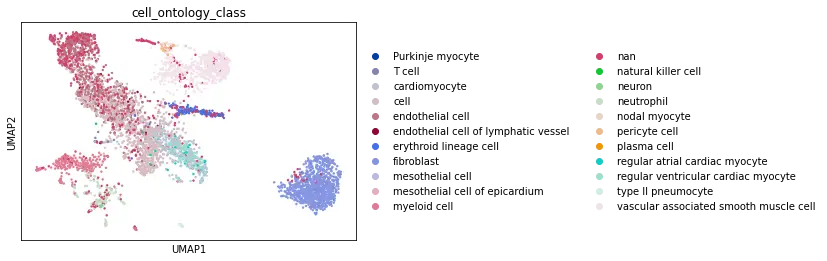
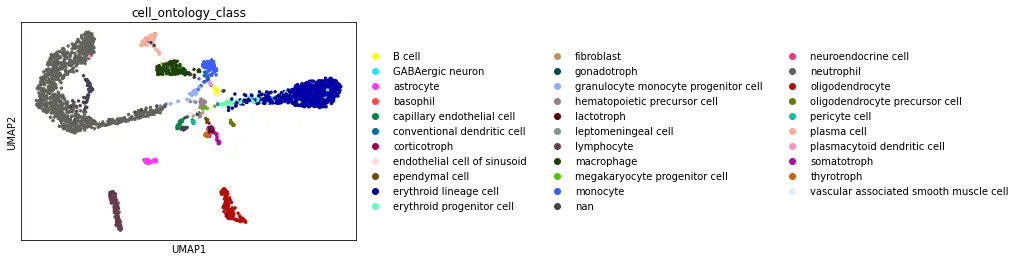
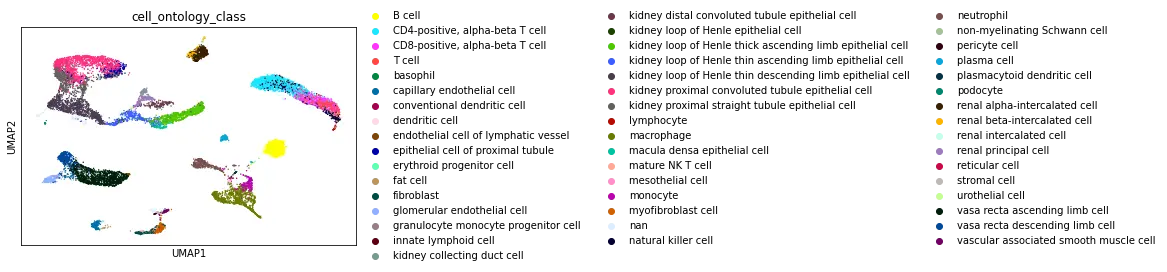
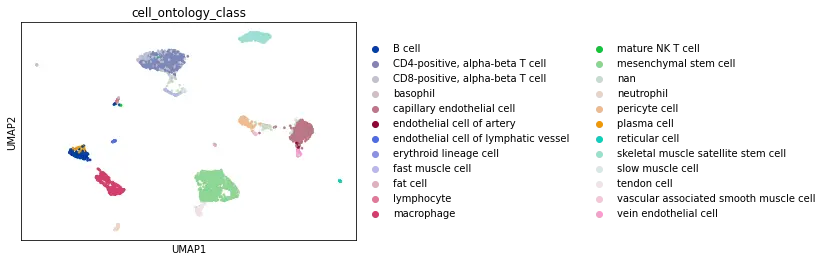
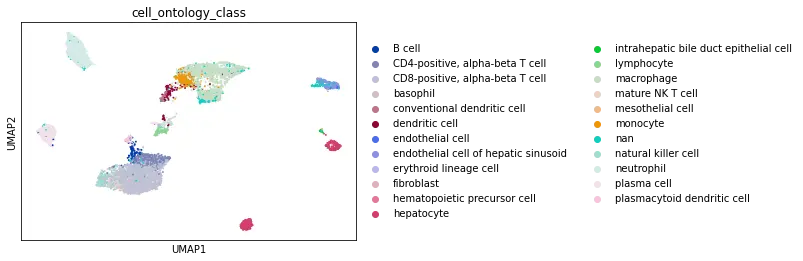
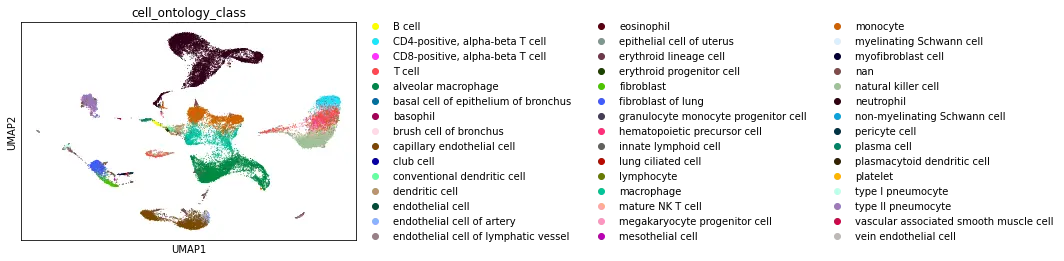
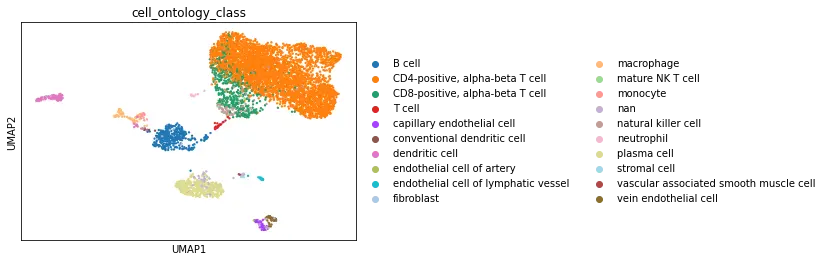
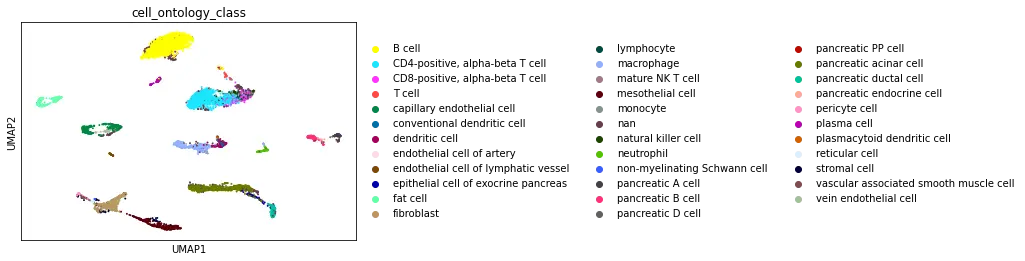
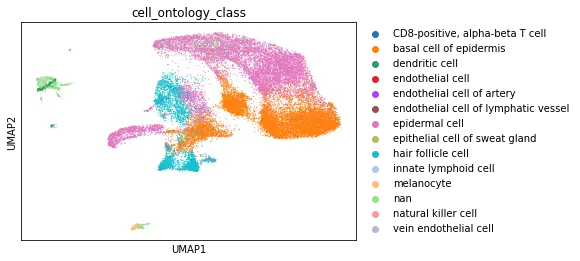
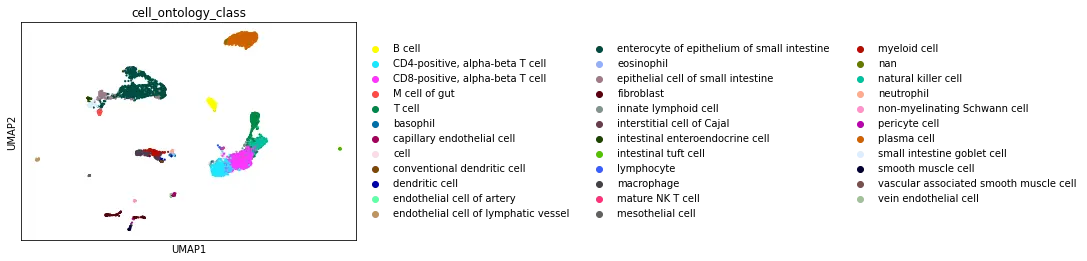
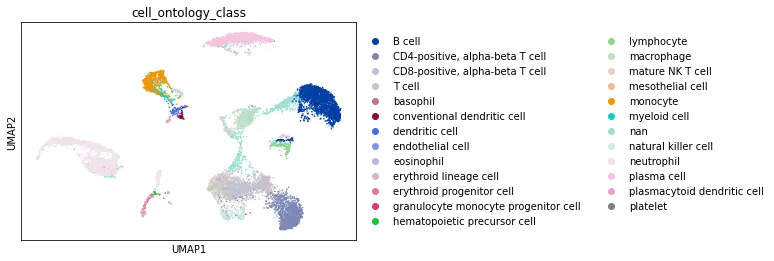
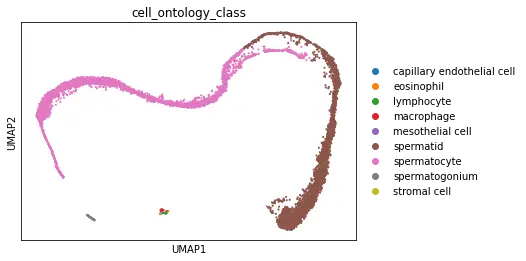
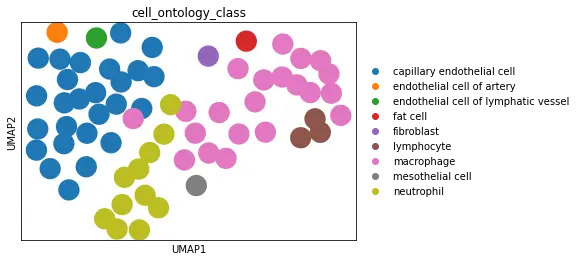
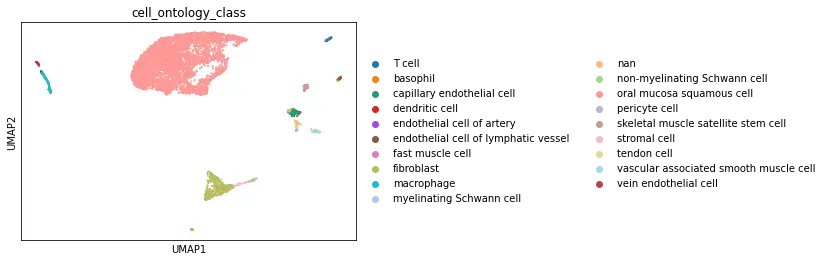
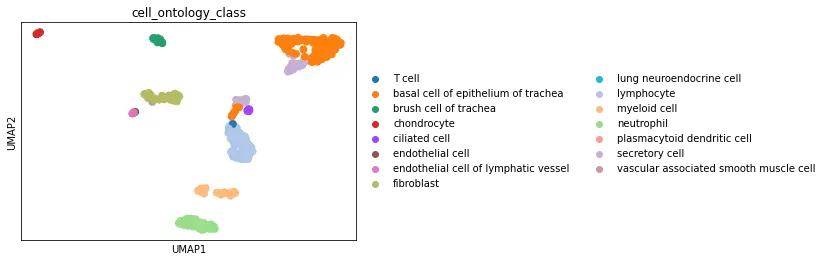
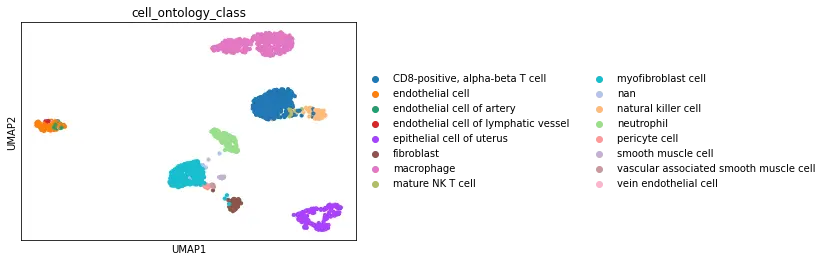
The UCSC browser enables you to interactively explore the Tabula Microcebus scRNA-seq dataset. Cells are displayed in a UMAP according to the overall transcriptional similarity. Gene expression in each cell can be visualized as a gradient-colored UMAP by searching the gene symbol in the “Genes” search box. Expression levels are displayed after library size normalization and natural log transformation of the raw data (i.e., ln(UMI/N *1e4 +1) for 10x, ln(reads/N *1e4 +1) for smartseq2; where N denotes the total number of reads or UMI of the cell). You will find below a link for each organ profiled in Tabula Microcebus.
The following metadata categories are available for the cells sequenced:
- nCount RNA: number of total reads (smartseq2) or UMI (10x).
- nFeature RNA: number of genes per cell.
- method: smartseq2 (full-length) or 10x (3prime).
- individual: lemur individuals available in the dataset.
- age: age of the individual (years).
- sex: sex of the individual.
- tissue: tissue sampled.
- subtissue: specification of the anatomical site sampled within the tissue. For tissues sampled multiple times at the same anatomical site, each 10x channel has a distinct subtissue number.
- compartment v1: functional compartment for each cell type (i.e., epithelial, endothelial, stromal, immune (hematopoietic, lymphoid, myeloid, megakaryocyte-erythroid), neural, germ).
- cell ontology class v1: cell type designation using the Cell Ontology.
- free annotation v1: detailed cell type designation using free text and molecular markers. PF, proliferating; LQ, low quality.
- dendrogram annotation number: number assigned to each of the 256 cell type designations across the Tabula Microcebus, arranged by compartment and then ordered by organ system or biological relatedness (see Fig. 2A in Tabula Microcebus manuscript). In addition, separate numbering is assigned to each of the hybrid and mix cell types (labeled with prefix letter ‘H’ and ‘M’, respectively).
- MHC: counts for the major histocompatibility complex (MHC) genes based on reannotation of the locus using expression data from the Tabula Microcebus (original locus annotation from NCBI’s Annotation Release 101). Note the count is only available for cells sequenced by 10x method and count is NAN for cells sequenced by smartseq2 method. nMHC_C_I, sum of normalized counts from classical Class I genes (Mimu-168, -W03, -W04, -249); nMHC_NC_I, non-classical Class I genes (Mimu-180ps, -191, -202, -208, -218, -229ps, -239ps) and nMHC_all_II, Class II genes (Mimu- DMA, DMB, DPA, DPB, DQA, DQB, DRA, DRB). Separate counts for each gene available in h5ad files on Figshare, with both raw counts and normalized counts (labeled with prefix letter ‘n’) provided.
H5ad files with the full list of metadata categories and numeric layers (raw and normalized counts) are available on FigShare. The data is organized as described in the data tab.